
More Information
Submitted: July 28, 2024 | Approved: September 13, 2024 | Published: September 16, 2024
How to cite this article: Dhiman N. Comparative Studies of Diclofenac Sodium (NSAID) Adsorption on Wheat (Triticum aestivum) Bran and Groundnut (Arachis hypogaea) Shell Powder using Vertical and Sequential Bed Column. Ann Adv Chem. 2024; 8(1): 021-029. Available from: https://dx.doi.org/10.29328/journal.aac.1001052.
DOI: 10.29328/journal.aac.1001052
Copyright License: © Dhiman N. This is an open access article distributed under the Creative Commons Attribution License, which permits unrestriCted use, distribution, and reproduCtion in any medium, provided the original work is properly cited.
Keywords: Agricultural adsorbents; Diclofenac sodium; Vertical column; Sequential bed column; breakthrough analysis

Comparative Studies of Diclofenac Sodium (NSAID) Adsorption on Wheat (Triticum aestivum) Bran and Groundnut (Arachis hypogaea) Shell Powder using Vertical and Sequential Bed Column
Neha Dhiman*
Goswami Ganesh Dutta Sanatan Dharma College, SeCtor-32, Chandigarh 160030, India
*Address for Correspondence: Neha Dhiman, Goswami Ganesh Dutta Sanatan Dharma College, SeCtor-32, Chandigarh 160030, India, Email: [email protected]
Wheat bran and groundnut shell powder have been used to study the mechanism of diclofenac sodium adsorption from aqueous solution using batch as well as column modes and maximum uptake is 84.3% for wheat bran and 82.4% for groundnut shell powder at pH 6, drug concentration 1 mg/L at 298 K for 30min. Isotherm and error analysis reveals that Freundlich and Langmuir isotherms fitted well. Kinetic studies show that the adsorption process follows second-order kinetics and thermodynamic study shows endothermic adsorption process. Column adsorption study is important for industrial scale adsorption and column studies have been carried out using vertical bed and sequential bed adsorption columns at pH 6 which is the optimum pH for maximum adsorption for batch experiments. Vertical and sequential bed columns setup is simple and economical which provides flow under gravity. The effect of varying inlet feed concentration and flow rate on the breakthrough and exhaustion time of columns has been studied to determine the bed capacities of both columns. Thomas model and Yoon-Nelson models fitted well with experimental data for continuous flow column studies.
Presence of analgesics and antipyretics in aquatic bodies has been determined as an emerging issue due to the adverse effects on the aqueous environment as well as human health [1-5]. Among the most consumed non-steroidal, anti-inflammatory, non-prescription drugs, diclofenac sodium [5] is the most frequently detected component in pharmaceutical wastewaters and surface water in the range 0.05-1 μg/L [1,6-8]. Diclofenac sodium, 2-[(2, 6-chlorophenyl) amino], a phenylacetic acid derivative is used for the treatment of degenerative joint diseases [9-11], however, this drug is highly toxic for vultures and cattle [10,12]. Various methods proposed for the removal of diclofenac from aqueous media include biodegradation [13], advanced oxidation and electrocoagulation, and electro-oxidation [1,14,15]. However due to the complexity of the structure of diclofenac, biodegradation is not effective, and advanced oxidation forms harmful byproducts [5] (Chemical structure 1). As a result, the adsorption process due to its high selectivity at low concentrations, easy regeneration of adsorbent, and cost-effectiveness [2,9] has gained importance. A variety of adsorbents have been studied [16], of which activated carbon is the most commonly used, but a major drawback is the cost of adsorbent as well as the regeneration cost [9]. As such there is a need for cost-effective adsorbents for the removal of drugs [17]. Literature reports the effective use of freely available agricultural by-products, as adsorbents for the removal of drugs [2,18-21] because they are inexpensive, freely available in bulk, have good adsorption potential, are selective in nature and there is no need of regeneration. The present study is aimed at studying the adsorption potential of wheat (Triticum aestivum) bran and groundnut (Arachis hypogaea) shell powder for the removal of diclofenac sodium from aqueous solution. Most of the reports on the removal of pharmaceutical pollutants pertain to batch studies but the equilibrium data obtained from batch adsorption experiments are not sufficient for designing a water treatment system on an industrial scale. For continuous operation [22] few reports are available on the use of sequential bed columns [22]. Keeping in mind the above factors, continuous column studies have also been conducted using vertical as well as sequential bed columns, as the set-up is simple and economical, no feed pumps or other mechanical devices are required, as the solution is made to flow under gravity, and can be applicable for small scale industries.
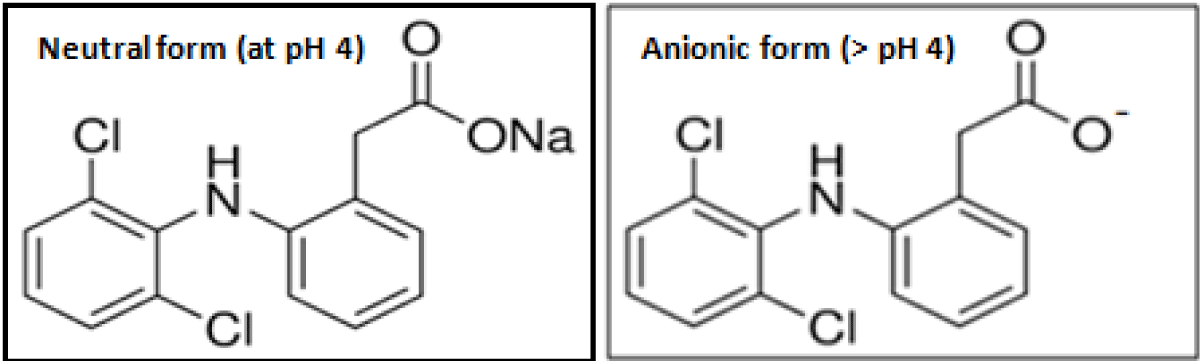
Chemical Structure 1: Structural forms of diclofenac sodium at different pH
Preparation of adsorbent
Preparation of wheat (Triticum aestivum) bran: Wheat bran (Bagrry’s) was washed, dried, crushed, and sieved to achieve a particle size range of 250-420 microns, and used as an adsorbent [23].
Preparation of groundnut (Arachis hypogaea) shell powder: Groundnuts were deseeded and shells were washed, dried in sunlight for 2-3 days, and finely ground. After sieve analysis 250-420 micron size particles were used as adsorbent [24,25].
Preparation of adsorbate solution
Diclofenac sodium injection (INTAS Pharmaceuticals Ltd.) of a 3 mL vial, containing 75 mg of the drug was used to prepare the stock solution of diclofenac sodium having a drug concentration of 100 mg/L in distilled water. Working solutions of 0.1 - 1.0 mg/L were obtained by dilution.
Estimation of diclofenac sodium
The drug solution prepared by dilution is analyzed spectrophotometrically, at a maximum wavelength of 276 nm [6,26] using a U.V- visible spectrophotometer (Shimadzu 2450, Japan) with 1 cm optical path length quartz cells. Calibration curves were plotted and distilled water was used as blank.
Batch adsorption studies
Batch experiments have been conducted by adding a known quantity of adsorbent (i.e 10 mg) in 10 mL of diclofenac solution in the concentration range 0.1-1.0 mg/L (keeping detection limit of the drug in wastewater), pH (5-11) under constant stirring for regular time intervals (i.e 5 to 30 min., until equilibrium is attained). The pH of the solution was adjusted using 0.1M HCl/NaOH. After adsorption experiments, the concentration of the supernatant was determined using a UV-visible spectrophotometer, (Shimadzu 2450, Japan) [27]. Each set of experiments was done in triplicate to check the reproducibility of results.
Column adsorption studies
Continuous flow column studies have been conducted using vertical as well as sequential bed adsorption columns by feeding the drug solution of varying influent concentration (0.6, 0.8, 1.0 mg/L) at different feed flow rates (5 mL/min., 7.5 mL/min. and 10 mL/min.) at pH 6 for both the adsorbents. The adsorption column was operated until the column had been exhausted or saturated (i.e. effluent concentration of the drug was approximately reaching 90% of Co (feed concentration) i.e. (Ct/Co = 0.9) [22].
Experimental setup
Vertical column: A vertical column of 1.5 cm diameter and 20 cm height containing adsorbent up to a depth of 1 cm was set up (Figure 1) (1.2 gm wheat bran and 1 gm groundnut shell powder). The downflow mode was used to collect the effluent from the bottom at regular time intervals and analyzed using U.V- a visible spectrophotometer [22].
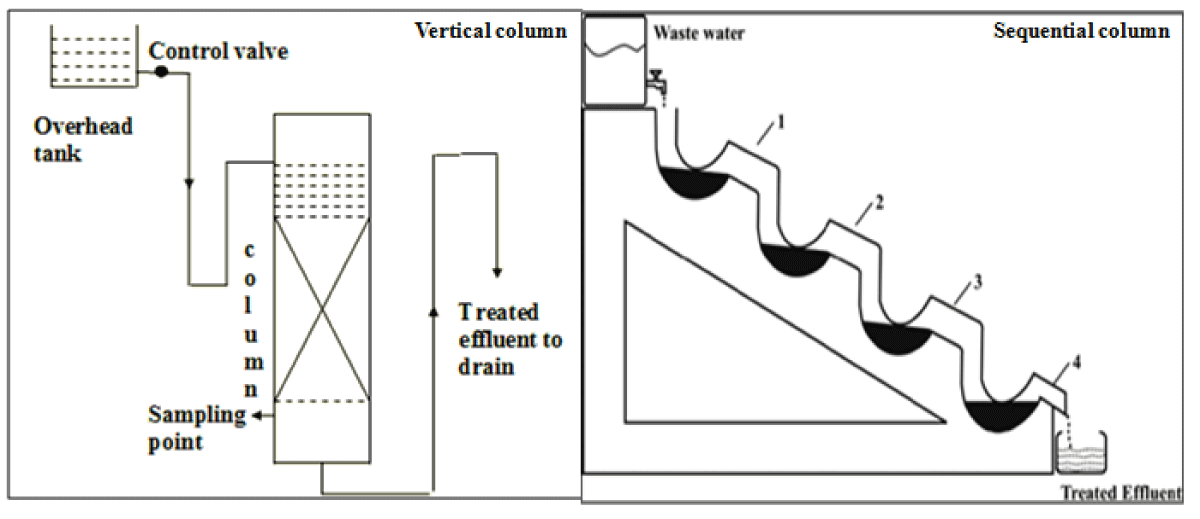
Figure 1: Setup of Vertical and sequential bed column.
Sequential bed column: The sequential bed column setup of 4 glass tubes of 1.5 cm diameter in a sequential manner was used in which each step contains 1/4th part of the total amount of adsorbent that is taken in the vertical bed column (Figure 1) [22]. Samples were collected from the bottom at regular time intervals for the determination of adsorbate concentration.
Breakthrough curves
The breakthrough curves analyses of continuous flow adsorption columns were studied using determined effluent concentration at different time intervals and plots were obtained Ct/Co against contact time (t), where (Ct) is effluent concentration and (Co) is adsorbate inlet concentration. The breakthrough point was obtained at Ct = 0.5Co and saturation at Ct = 0.9Co [22].
Characterization of adsorbents
Proximate analysis: The moisture content is found to be 7.8% for wheat bran and 9.7% for groundnut shell powder at 100 °C. Samples were further heated to get constant weight and ash content was found to be 3.90% for wheat bran and 7% for groundnut shell powder at 600 °C [24].
Sieve analysis: Sieve analysis was carried out and particles of 250-420 microns in size were used as adsorbent in both cases [24].
X-ray diffraction (XRD): XRD (Figure 2a) of wheat bran shows the amorphous nature of the sample with no prints of crystallinity [28]. Groundnut shell powder (Figure 2c) indicates broad diffraction peaks with traces of amorphous cellulose in the sample [24].
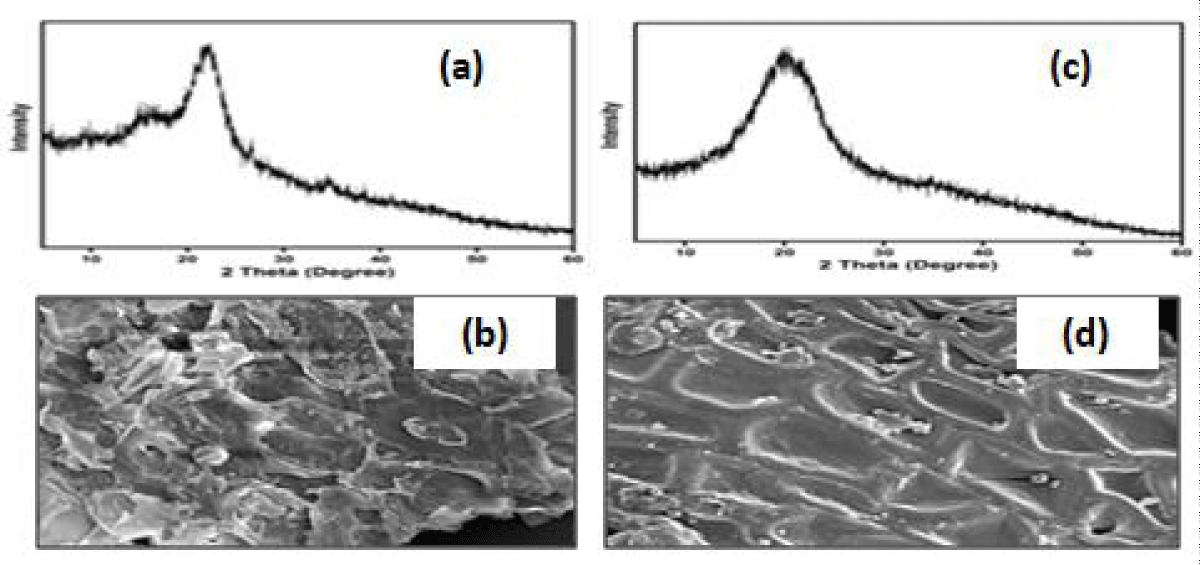
Figure 2: (a) Wheat bran XRD (b) SEM images (c) groundnut shell powder XRD (d) SEM images.
BET: The Brunauer-Emmet-Teller (BET) analysis of both adsorbents was performed by initial degassing at 120°C [22]. The surface area is 112 m2/g the pore volume is 0.10 cm3/g and the mean pore size is 5.14 nm of wheat bran. The surface area is 123 m2/g, the pore volume is 0.19 cm3/g, and the mean pore size of 6.17 nm groundnut shell powder.
Scanning Electron Microscopy (SEM): The SEM images show that wheat bran (Figure 2b) exhibits a platelet-like structure and groundnut shell powder (Figure 2d) has a porous rough surface [29] and exhibits a flake-like structure [30].
FTIR: FTIR of wheat bran (Figure 3a) shows bands band at 3433 cm-1, 2932 cm-1, and 1649 cm-1 corresponding to the (O-H) and chemisorbed water, stretching vibrations of C-H group and carbonyl group (C=O). The peak at 1151 cm-1 is assigned to (-CN) and at 1029 cm-1 for the C-O bond of cellulose [23]. After adsorption (Figure 3b) presence of diclofenac sodium shows due to 3290 cm-1, 1666 cm-1, and 1579 cm-1. The peak at 1373-1337 cm-1 corresponds to C-N stretching [31] of diclofenac after adsorption and at 749 cm-1 for diclofenac charaCteristic [31].
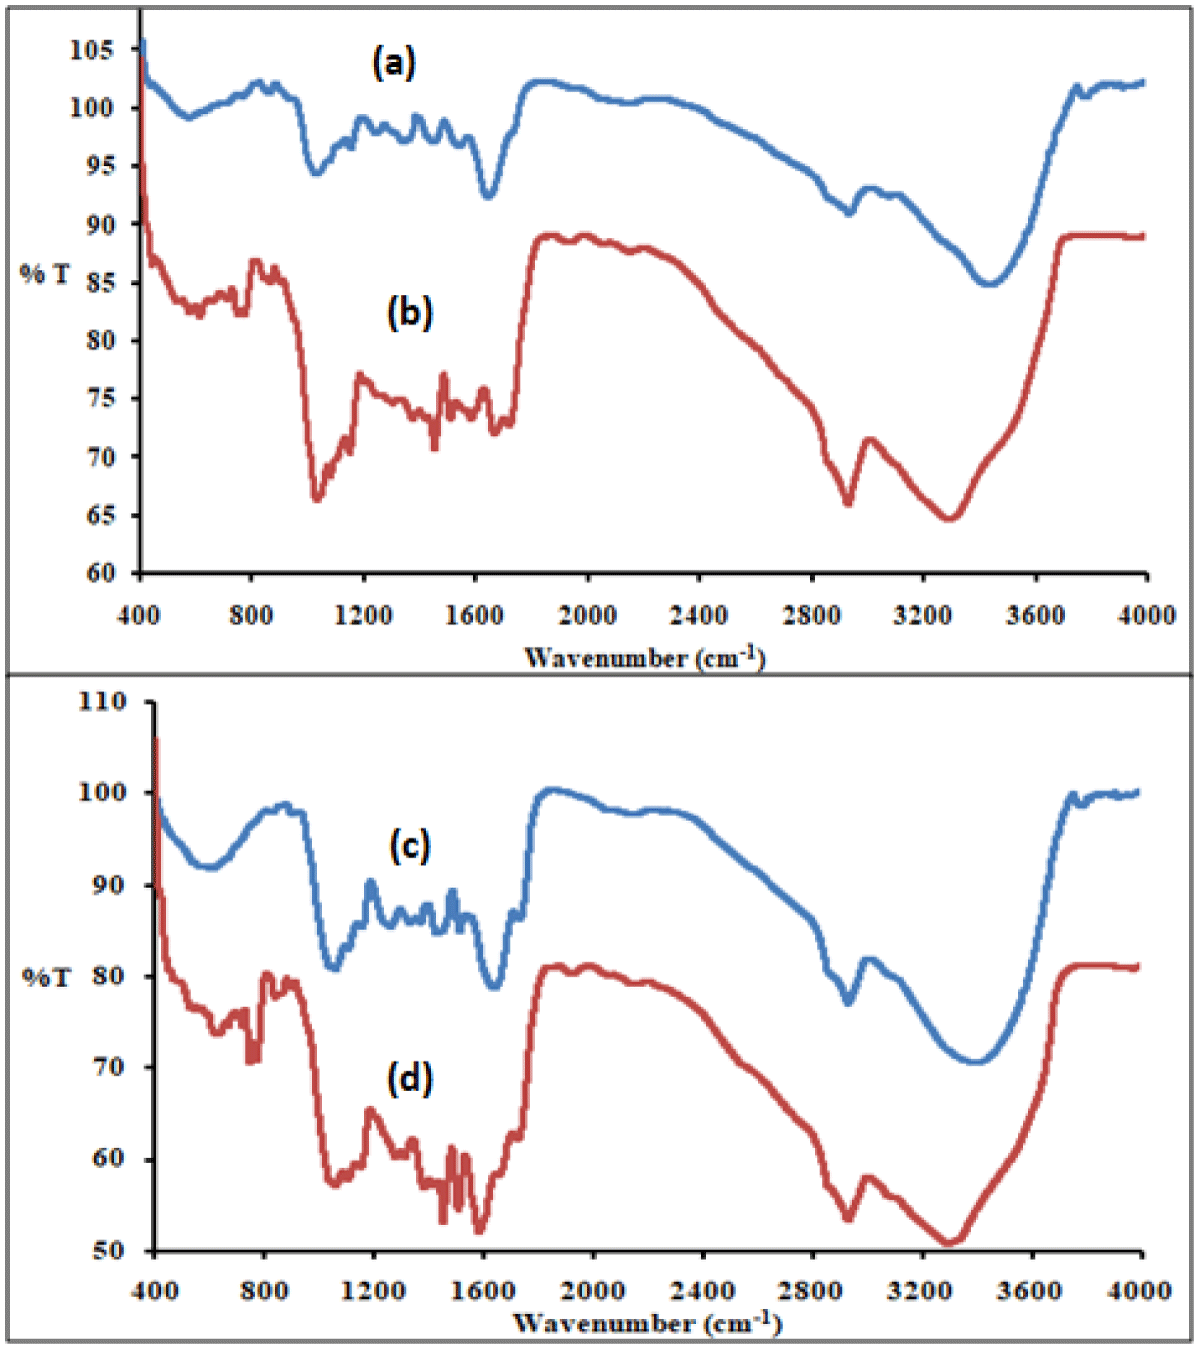
Figure 3: FTIR of (a) before adsorption (b) after adsorption for wheat bran (c) before adsorption (d) after adsorption for groundnut shell powder before adsorption.
In groundnut, shell powder (Figure 3c), the peak at 3405, 1731, and 1638 cm-1 is due to (O-H) and chemisorbed water, hemicelluloses, and lignin respectively [22]. After adsorption (Figure 3d) the peak at 747 cm-1 shows the presence of diclofenac.
Effect of pH and point zero charge (pHpzc)
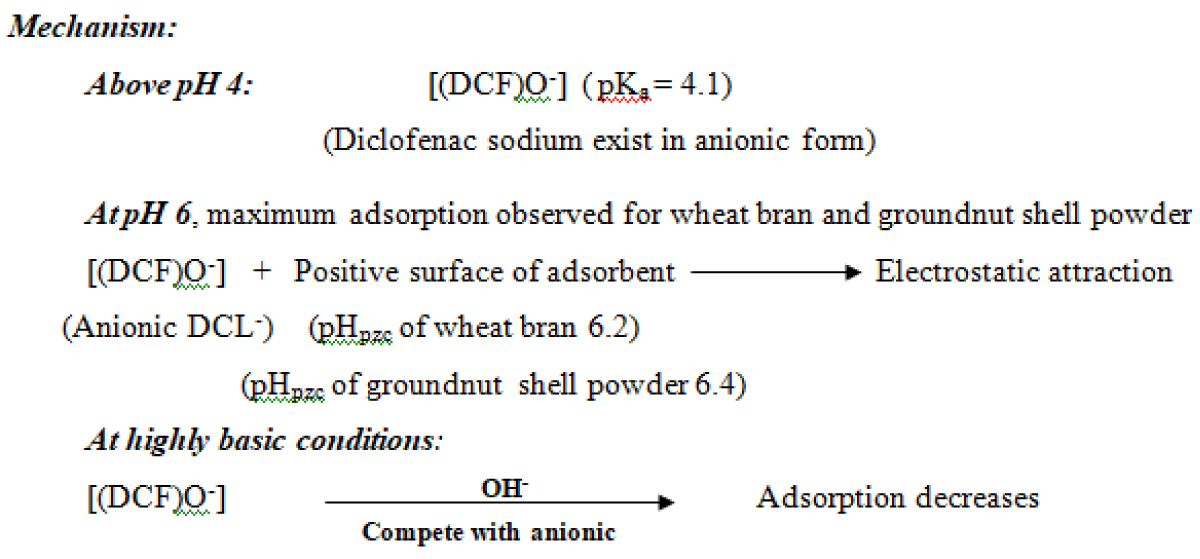
To study the effect of pH on the removal of diclofenac pH was varied in the range 5-11 (precipitation occurs at pH 4.8 and beyond pH 11) for a contact time of 30 min., drug concentration (0.1-1.0 mg/L) at 25 ºC. The adsorption of diclofenac increases with an increase in pH and maxima obtained at pH 6 for both the adsorbents (Figure 4). For diclofenac sodium (pKa 4.1). Below pH 4, cationic diclofenac sodium, and above pH 4 anionic diclofenac was predominate [32,33]. Point zero charge, pHpzc was found to be 6.2 for wheat bran and 6.4 for groundnut shell powder [22,23]. Above pH 4, electrostatic attraction between anionic diclofenac and positively charged adsorbent is the predominant mechanism at pH 6 for both adsorbents. Above pH 6, a negatively charged adsorbent surface causes electrostatic repulsion for diclofenac sodium; which leads to a decrease in adsorption [34].
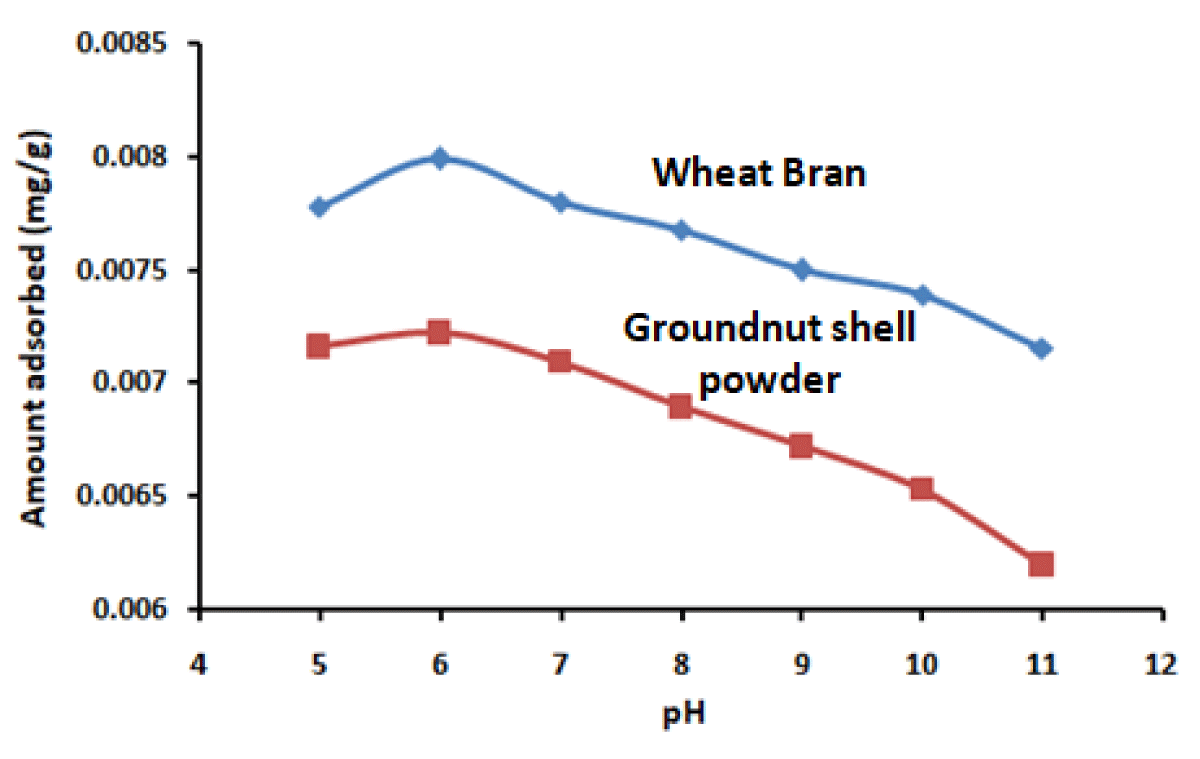
Figure 4: Effect of pH on amount of diclofenac sodium adsorbed on wheat bran and groundnut shell powder for a contact time of 30 minutes and drug concentration 1 mg/L.
Effect of initial concentration and contact time
The effect of initial drug concentration and contact time has been studied for the concentration range 0.1 - 1.0 mg/L at varying pH (5-11), with contact time 0 to 30 min. at 25 ºC. Figure 5 shows that with the increase in concentration and contact time, the amount adsorbed increases, and equilibrium was obtained within 30 min. in both cases, which may be attributed to larger surface site availability at early stages and higher dilution. With time, available sites get occupied, leading to a decrease in the adsorption rate [27].
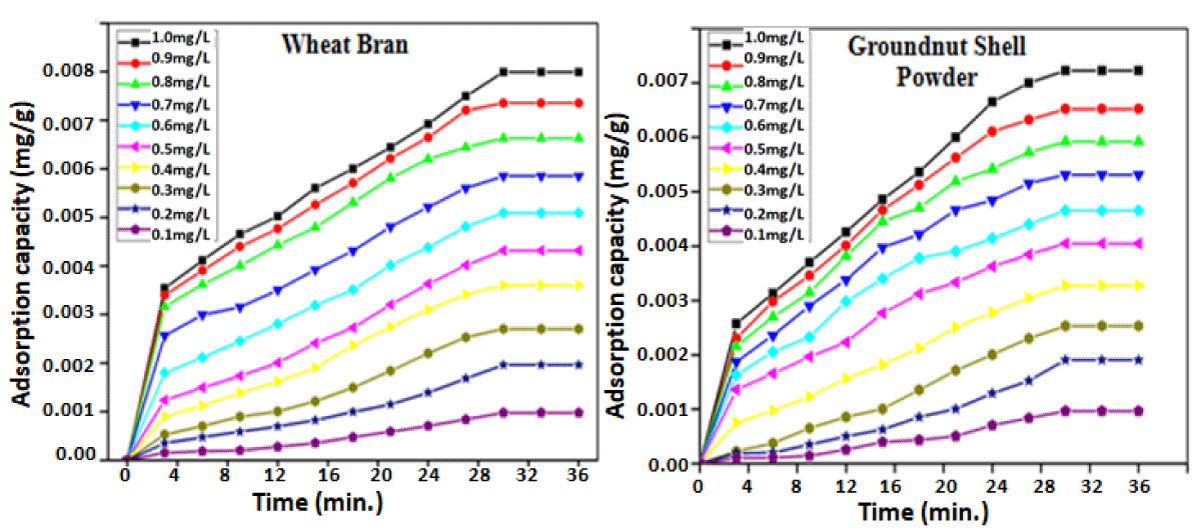
Figure 5: Amount of diclofenac sodium adsorbed (mg g-1) vs time (min.) using wheat bran and groundnut shell powder at different drug concentrations at pH-6.
Adsorption isotherm modeling
The experimental data at equilibrium conditions were analyzed using Freundlich (Eq.1), Langmuir (Eq.2), and Temkin (Eq.4) adsorption isotherm models.
(1)
(2)
where Ce is the equilibrium concentration (mgL-1) and qe is the equilibrium amount adsorbed (mgg-1), n and Kf are Freundlich isotherm (Figure 6a) constants, KL related to the affinity of the binding sites (Lmg-1), aL the Langmuir isotherm (Figure 6b) constant. Langmuir model can be expressed in terms of separation faCtor or equilibrium parameter RL,
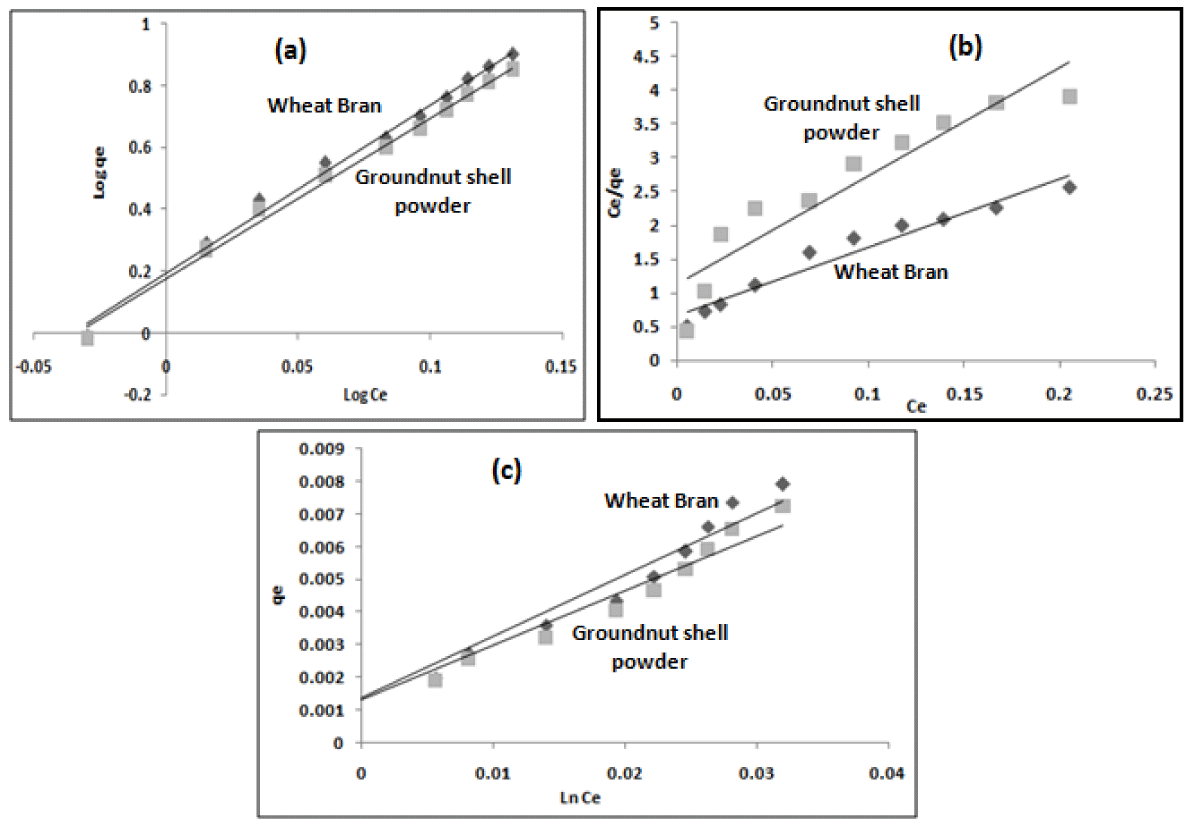
Figure 6: (a) Freundlich (b) Langmuir (c) Temkin plots for the adsorption of diclofenac sodium using wheat bran and groundnut shell powder at different drug concentrations at pH-6.
(3)
The values of RL are found to be 0.034 and 0.042 for wheat bran and groundnut shell powder respectively indicating that favorable adsorption occurs in each case [27].
(4)
Where AT is the equilibrium binding constant (Lg-1) corresponding to maximum binding energy, BT = (RT)/bT, is constantly related to the heat of adsorption (Jmol-1), bT is Temkin isotherm (Figure 6c) constant, T is the absolute temperature (K) and R is the universal gas constant, 8.314 J mol-1 K-1. The values of isotherm constants are presented in Table 1. Freundlich and Langmuir isotherm models show favorable and monolayer adsorption and effectiveness of the adsorbent [20,34]. A straight line plot of qe vs. ln Ce was obtained, which indicates the applicability of the Temkin isotherm model [32].
| Table 1: Isotherm and kinetic constants for adsorption of diclofenac sodium on wheat bran and groundnut shell powder for contact time of 150 min., at 298 K and pH 6. | ||||||||||||||||
| Isotherm constants | ||||||||||||||||
| Freundlich | Langmuir | Temkin | ||||||||||||||
| n | Kf (mg/g) |
R2 | KL (L/mg) |
aL | R2 | AT (L/g) |
BT (J/mol) |
bT | R2 | |||||||
| Wheat bran | 0.63 | 0.46 | 0.992 | 0.45 | 0.11 | 0.982 | 0.85 | 1.559 | 1.5 x 10³ | 0.943 | ||||||
| Groundnut shell powder | 1.05 | 1.23 | 0.991 | 0.86 | 0.12 | 0.976 | 1.23 | 1.026 | 1.7 x 10³ | 0.925 | ||||||
| Kinetic constants | ||||||||||||||||
| Pseudo first order | Pseudo second order | Intraparticle diffusion | ||||||||||||||
| Kad (min-1) |
qe (mg/g) |
R2 | qe (mg/g) |
K2 (g/mg/min) |
R2 | Kp (mgg-1min-1) |
R2 | |||||||||
| Wheat bran | 0.011 | 2.18 | 0.916 | 8.15 | 0.15x10⁻³ | 0.980 | 2.081 | 0.980 | ||||||||
| Groundnut shell powder | 0.019 | 4.35 | 0.851 | 9.04 | 0.12x10⁻³ | 0.950 | 2.522 | 0.981 | ||||||||
Error analysis for isotherm studies
To determine the best fit of isotherm models, five different error functions of non-linear regression can be used [24], as follows:
Sum of squared errors (SSE)
(5)
Sum of absolute errors (SAE)
(6)
Average relative error (ARE)
(7)
Hybrid fraCtional error function (HYBRID)
(8)
Marquardt’s percent standard deviation (MPDS)
(9)
The values of the five error functions have been calculated and a comparison among error function values (Table 2) suggests that Freundlich and Langmuir isotherm models, with high correlation coefficients and low error function values, are a better fit as compared to the Temkin model for the adsorption of diclofenac on both the adsorbents under study [24].
| Table 2: Error analysis constant values for adsorption of diclofenac sodium using wheat bran and groundnut shell powder for contact time of 30 min. at 298 K and pH 6. | |||
| Error analysis function | Freundlich | Langmuir | Temkin |
| Wheat Bran | |||
| qe, exp | 0.0079 mg/g | 0.0079 mg/g | 0.0079 mg/g |
| qe, cal | 0.0075 mg/g | 0.0074 mg/g | 0.0070 mg/g |
| SSE | 0.3 x 10⁻³ | 0.09 x 10⁻³ | 0.791 |
| SAE | 0.29 x 10⁻² | 0.17 x 10⁻² | 0.257 |
| ARE | 0.64 x 10⁻² | 0.17 x 10⁻³ | 0.749 |
| HYBRID | 0.71 x 10⁻³ | 0.15 x 10⁻³ | 1.12 x 10⁻¹ |
| MPSD | 0.65 x 10⁻⁵ | 0.03 x 10⁻⁵ | 1.24 x 10⁻² |
| Groundnut Shell Powder | |||
| qe, exp | 0.0072 mg/g | 0.0072 mg/g | 0.0072 mg/g |
| qe, cal | 0.0068 mg/g | 0.0069 mg/g | 0.0060 mg/g |
| SSE | 0.21 x 10⁻³ | 0.08 x 10⁻³ | 0.687 |
| SAE | 0.24 x 10⁻² | 0.14 x 10⁻² | 0.254 |
| ARE | 0.44 x10⁻² | 0.12 x 10⁻³ | 0.543 |
| HYBRID | 0.52 x 10⁻³ | 0.13 x 10⁻³ | 1.23 x 10⁻³ |
| MPSD | 0.55 x 10⁻⁵ | 0.07 x 10⁻⁵ | 1.34 x 10⁻² |
Kinetic studies
The equilibrium data obtained optimum conditions for both the adsorbents have been analyzed for kinetic studies using pseudo first order (Figure 7a) (Eq. 10), second-order (Eq. 11) rate equations, and the possibility of intraparticle diffusion, using Morris Weber model (Eq. 12).
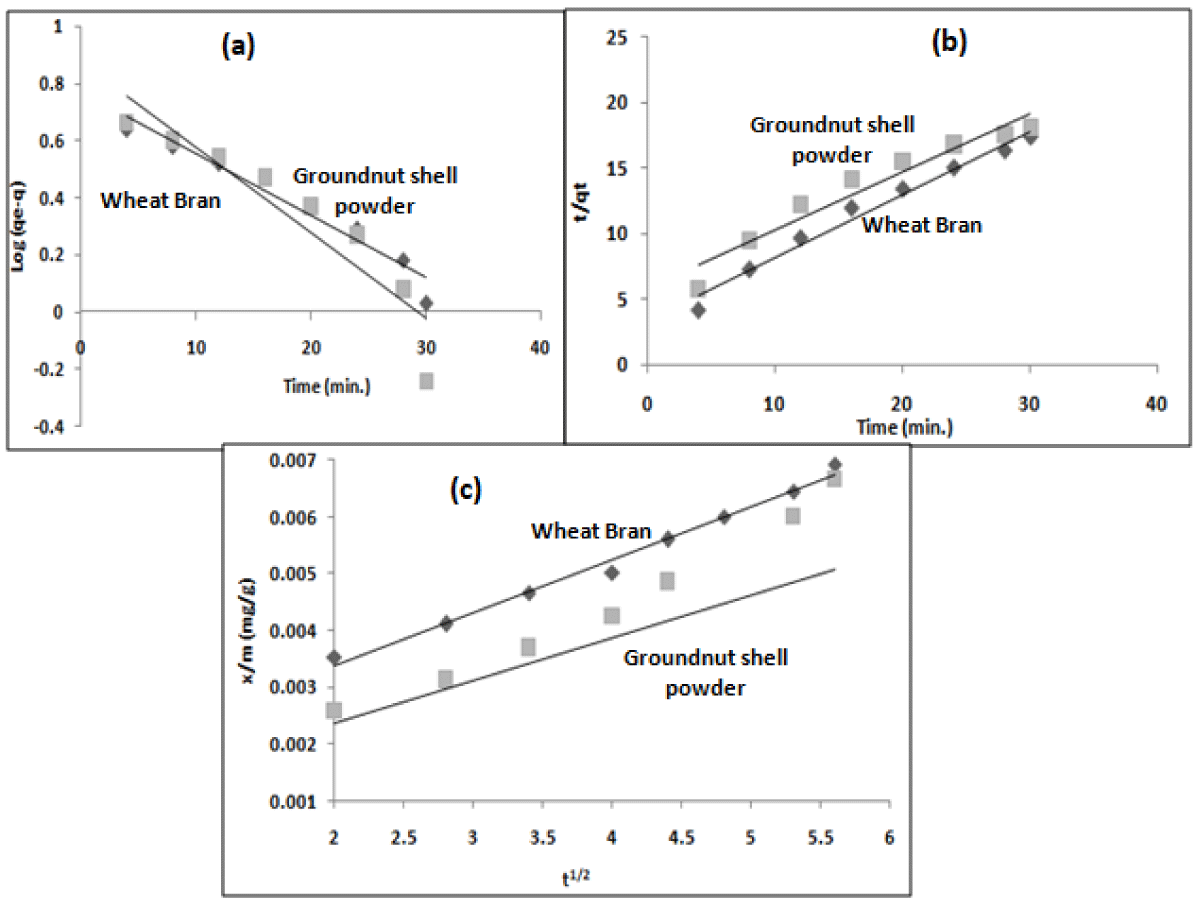
Figure 7: (a) First order (b) second order (c) Intraparticle diffusion for the adsorption of diclofenac sodium using wheat bran and groundnut shell powder at different time intervals at pH-6.
(10)
(11)
where qe and q (mg g−1) are the amounts of drug adsorbed at equilibrium and at any time taken for study respectively, t (min) is the time of contact and kad is the adsorption rate constant (min-1), K2 is the equilibrium rate constant of pseudo-second order adsorption (gmg-1 min-1). The values of kinetic constants are given in Table 1. A straight line plot (Figure 7b) obtained from the plot of t/qt vs. t shows a better fit of pseudo-second-order kinetics [24].
(12)
where q is the amount of drug adsorbed at different time intervals (mgg-1), Kp is the intraparticle diffusion constant (mgg-1 min-1) and t is contact time (min.). Kp is calculated from the slope of the linear plot of q vs t1/2 and is given in Table 1.
A straight line plot (Figure 7c) has been obtained but does not pass through the origin, which indicates that intraparticle diffusion occurs but is not the rate-determining step [27].
Effect of temperature
The effect of temperature was investigated for the temperatures; 25º, 30º, 35º, 40º, and 45 ºC. The adsorption capacity increases from 0.0079 to 0.0082 mg/g for wheat bran and 0.0072 to 0.0081 mg/g for groundnut shell powder with an increase in temperature from 298K to 318K respectively. The enhancement in adsorption capacity with an increase in temperature occurs due to an increase in the number of sorption sites generated because of the breaking of some internal bonds near the active surface sites of the adsorbent in each case [9].
Thermodynamic studies
The following equations have been used to determine thermodynamic parameters for the adsorption process.
(13)
(14)
Kc is the equilibrium constant given by Csoild/Cliquid; where Csoild is the solid phase equilibrium concentration and Cliquid is the liquid phase equilibrium concentration of adsorbate (mg/L), T is the temperature in degree Kelvin, and R is gas constant. The values of change in enthalpy (∆H0) (J/K/mol) and entropy (∆S0) (J/K-1mol-1) are 0.109 and 0.122 for wheat bran and 0.203 and 0.115 for groundnut shell powder. The value of ∆G0 is found to be (-2.24 x 10³) and (-2.22 x 10³) for wheat bran and groundnut shell powder respectively. The negative values of ∆G0 indicate feasibility and spontaneous nature, and positive values of ∆H0 and ∆S<0 for both adsorbents suggest the endothermic nature of adsorption and increase in randomness at solid solution interface during adsorption [9,27].
Column adsorption study
Effect of feed Concentration and flow rate: An attempt has been made to study the effect of influent concentration and the flow rate on the efficiency of the columns. The concentrations have been varied between 0.8 to 1.0 mg/L at a flow rate of 5 mL/min. and it was observed that the removal efficiency decreases with an increase in concentration for vertical as well as sequential adsorption columns, therefore at higher dilution larger volumes can be treated due to a decrease in concentration gradient and mass transfer coefficient [24,34,35]. The adsorption capacities of wheat bran and groundnut shell powder are 0.0067 mg/g and 0.0050 mg/g for vertical bed column and 0.0061 mg/g and 0.0060 mg/g for sequential bed column for 0.8 mg/L feed concentration. For feed concentration 0.9 mg/L, the adsorption capacities of wheat bran decrease to 0.0055 mg/g and for groundnut shell powder to 0.0040 mg/g for the vertical bed column. The values are 0.0050 mg/g and 0.0039 mg/g for wheat bran and groundnut shell powder sequential bed column. This further decreases to 0.0041 mg/g and 0.0037 mg/g for vertical bed and 0.0048 mg/g and 0.0035 mg/g for sequential bed column for wheat bran and groundnut shell powder respectively for 1.0 mg/L feed concentration at a flow rate of 5 mL/min. In all the cases.
To study the effect of flow rate the flow rates have been varied from 5 mL/min. to 10 mL/min., at a constant influent concentration of 0.8 mg/L in both the columns, it has been observed that at a higher flow rate, the column was saturated earlier probably due to lesser residence time of solution in bed which resulted in lesser mass transfer and lesser adsorption [24]. For fixed feed concentration of 0.8 mg/L, when the flow rate was increased from 5 mL/min. to 7.5 mL/min. to 10 mL/min., the adsorption capacities of wheat bran have been found to decrease from 0.0067 mg/g to 0.0050 mg/g to 0.0042 mg/g for vertical bed column and from 0.0061 mg/g to 0.0055 mg/g and 0.0044 mg/g for sequential bed column. Similarly for groundnut shell powder adsorption capacities decrease from 0.0050 mg/g to 0.0040 mg/g to 0.0038 mg/g for vertical bed and from 0.0060 mg/g to 0.0040 mg/g to 0.0037 mg/g for sequential bed column.
The breakthrough time corresponding to Ct/Co = 0.5 and the exhaustion time corresponding to Ct/Co = 0.90 were obtained for drug concentration 0.8 mg/L for both the adsorbents using vertical as well as sequential columns. breakthrough point occurred after 30 min and exhaustion time was 60 min for wheat bran using vertical column and 40 min. and 80 min. for the sequential bed column while for groundnut shell powder breakthrough occurred at 40 min and 70 min. For vertical and sequential adsorption columns and the exhaustion time was 50 min and 60 min for vertical and sequential adsorption columns respectively (Figure 8). As the drug concentration increased, the breakthrough curve became steeper, and the breakthrough time decreased [24,36].
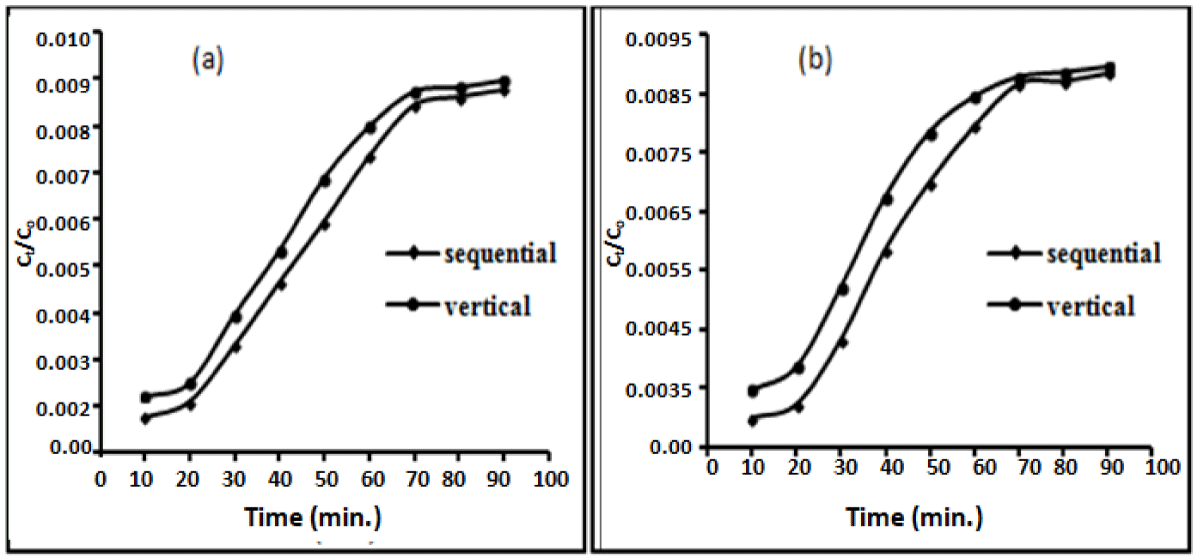
Figure 8: Breakthrough curves at flow rate 5 mL/min., drug concentration 0.8 mg/L for adsorption of diclofenac sodium on wheat bran (WB) and groundnut shell powder (GSP) in Vertical and Sequential Bed columns.
Modeling of breakthrough curves
The data obtained have been subjected to analyses using the Thomas model and Yoon–Nelson model.
Thomas model: The Thomas model is a widely used method, based on breakthrough results, to study column performance. The linear form of the model is given as:
(16)
Where KTH is Thomas rate constant (L min-1mg-1); qo the maximum solid-phase concentration of the solute (mg g-1) (adsorption capacity of the bed), M is the mass of adsorbent (g); Q is the flow rate (L min-1). The values of KTH and the qo (Table 3) can be determined from the plot of [ln(Co/Ct)-1] against time at a given flow rate [24]. As the initial drug concentration increases the values of KTH (L min-1mg-1) and adsorption capacity, qo (mg/g) shows a significant decrease, whereas, KTH and qo increase with an increase in flow rate, for both the columns, which may be attributed to the higher driving force due to difference between the solid and liquid phase concentration of adsorbate [24,19].
| Table 3: Column parameters for adsorption of diclofenac sodium on wheat bran and groundnut shell powder for feed concentration 0.8 mg/L, flow rate 5mL/min., at 298 K at pH 6 for vertical bed and sequential bed column. | ||||||||||||
| Adsorbent | Thomas Model | Yoon- Nelson Model | ||||||||||
| Vertical column | Sequential column | Vertical column | Sequential column | |||||||||
| KYN (l mg-1) | τ(min) | R2 | KYN (l mg-1) | τ(min) | R2 | KTH(l min-1mg-1) | qo (mgg-1) | R2 | KTH (l min-1mg-1) |
qo (mgg-1) | R2 | |
| wheat bran | 0.007 | 80.1 | 0.981 | 0.010 | 44.5 | 0.952 | 0.12 x 10⁻⁴ | 0.003 | 0.971 | 0.61 x 10⁻⁴ | 0.005 | 0.973 |
| groundnut shell powder | 0.005 | 68.7 | 0.876 | 0.010 | 22.5 | 0.987 | 0.78 x 10⁻⁴ | 0.0045 | 0.986 | 0.62 x 10⁻⁴ | 0.004 | 0.955 |
The Yoon–Nelson model: This model is a simple theoretical model used to prediCt the rate constant and time required for a 50 % adsorbate breakthrough. The linearized model is expressed as:
(17)
where KYN is the rate constant (l mg-1), τ the time required for 50% adsorbate breakthrough (min). The constants KYN and τ can be determined from a plot of [ln(Ct/Co)-Ct] against time t at any given adsorption conditions (Table 3). It has been observed that the value of KYN increases and τ, time taken for 50% breakthrough decreases with an increase in initial drug concentration and flow rate [24,39,40].
At present wheat bran and groundnut shell powder have been used as agricultural waste adsorbents for the removal of diclofenac sodium and maximum uptake is 84.3% for wheat bran and 82.4% for groundnut shell powder at pH 6, drug concentration 1 mg/L at 298 K for 30 min. As shown by SEM studies both the adsorbents have an amorphous nature and rough surface so the possibility of drug adsorption is more which is further confirmed by FTIR results. As mentioned in the literature the drug concentration detected in wastewater is in the range of micrograms per liter that’s why a study has been conducted at low concentrations of adsorbate solution. The equilibrium adsorption capacities for continuous flow column studies using both sequential bed and vertical columns show that both the adsorbents can be used as efficient adsorbents for pharmaceutical pollutant removal. Adsorption capacity was found to be slightly greater for sequential bed columns as compared to vertical columns, which shows that the sequential bed column can be efficiently used in small-scale industries for the removal of water pollutants, also the setup is simple and economical. On the other hand, a comparative study of both the adsorbents shows that both the adsorbents are effective for the removal of drugs, whereas wheat bran shows slightly greater adsorption capacity for the removal of diclofenac sodium.
- Rivera-Utrilla J, Sanchez-Polo M, Ferro-Garcia MA, Prados-Joya G, Ocampo-Perez R. Pharmaceuticals as emerging contaminants and their removal from water: A review. Chemosphere. 2013;93:1268-1287. Available from: https://doi.org/10.1016/j.chemosphere.2013.07.059
- Bui TX, Pham VH, Le ST, Choi H. Adsorption of pharmaceuticals onto trimethylsilylated mesoporous SBA-15. J Hazard Mater. 2013;254-255:345-353. Available from: https://doi.org/10.1016/j.jhazmat.2013.04.003
- Ebele AJ, Abdallah MAE, Harrad S. Pharmaceuticals and personal care products (PPCPs) in the freshwater aquatic environment. Emerg Contam. 2017;3:1-16. Available from: https://doi.org/10.1016/j.emcon.2016.12.004
- Lach J, Szymonik A. Adsorption of diclofenac sodium from aqueous solutions on commercial activated carbons. Desalination Water Treat. 2020;186:418-429. Available from: https://doi.org/10.5004/dwt.2020.25567
- Lu X, Shao Y, Gao N, Chen J, Zhang Y, Wang Q, et al. Adsorption and removal of clofibric acid and diclofenac from water with MIEX resin. Chemosphere. 2016;161:400-411. Available from: https://doi.org/10.1016/j.chemosphere.2016.07.025
- Cherik D, Benali M, Louhab K. Occurrence, ecotoxicology, removal of diclofenac by adsorption on activated carbon and biodegradation and its effect on baCterial community: A review. World Sci News. 2015;10:116-144. Available from: https://worldscientificnews.com/wp-content/uploads/2024/01/WSn-16-2015-96-124.pdf
- Bernardo M, Rodrigues S, Lapa N, Matos I, Lemos F, Batista MKS, et al. High efficacy on diclofenac removal by activated carbon produced from potato peel waste. Int J Environ Sci Technol. 2016;13:1989-2000. Available from: https://link.springer.com/article/10.1007/s13762-016-1030-3
- Bhadra BN, Seo PW, Jhung SH. Adsorption of diclofenac sodium from water using oxidized activated carbon. Chem Eng J. 2016;301:27-34. Available from: http://dx.doi.org/10.1016/j.cej.2016.04.143
- Antunes M, Esteves VI, Guegan R, Crespo JS, Fernandes AN, Giovanela M. Removal of diclofenac sodium from aqueous solution by Isabel grape bagasse. Chem Eng J. 2012;192:114-121. Available from: https://doi.org/10.1016/j.cej.2012.03.062
- Dai CM, Geissen SU, Zhang YL, Zhang YJ, Zhou XF. selective removal of diclofenac from contaminated water using molecularly imprinted polymer microspheres. Environ Pollut. 2011;159:1660-1666. Available from: https://doi.org/10.1016/j.envpol.2011.02.041
- Chang EE, Wan JC, Kim H, Liang CH, Dai YD, Chiang PC. Adsorption of seleCted pharmaceutical compounds onto activated carbon in dilute aqueous solutions exemplified by acetaminophen, diclofenac, and sulfamethoxazole. Sci World J. 2015;2015:186501. Available from: https://doi.org/10.1155/2015/186501
- Swan G, Naidoo V, Cuthbert R, Green RE, Pain DJ, Swarup D,et al. Removing the threat of diclofenac to critically endangered Asian vultures. PLoS Biol. 2006;4:395-402. Available from: https://doi.org/10.1371/journal.pbio.0040066
- Bessa VS, Moreira IS, Tiritan ME, Castro P ML. Enrichment of baCterial strains for the biodegradation of diclofenac and carbamazepine from activated sludge. Int Biodeterior Biodegrad. 2017;120:135-42. Available from: https://doi.org/10.1016/j.ibiod.2017.02.008
- Boleda M R, Galceran M T, Ventura F. Behavior of pharmaceuticals and drugs of abuse in a drinking water treatment plant (DWTP) using combined conventional and ultrafiltration and reverse osmosis (UF/RO) treatments. Environ Pollut. 2011;159:1584-1591. Available from: https://doi.org/10.1016/j.envpol.2011.02.051
- Dewoolkar K D, Jayaram R V. Photocatalytic degradation of diclofenac. Int J Res Chem Environ. 2013;3:94-99.
- Mansour F, Al-Hindi M, Yahfoufi R, Ayoub GM, Ahmad MN. The use of activated carbon for the removal of pharmaceuticals from aqueous solutions: a review. Rev Environ Sci Biotechnol. 2018;17:109-145. Available from: https://link.springer.com/article/10.1007/s11157-017-9456-8
- Kowsalya E, Sharmila S, Rebecca LJ, Yogasri K. Ground nut shell and spent tea: an eco-friendly low-cost adsorbent. Int J Pharm Sci Rev Res. 2015;31:132-134. Available from: https://www.researchgate.net/publication/282375223_Ground_nut_shell_and_spent_tea_An_eco-friendly_low_cost_adsorbent
- Ayo MD, Madufor IC, Onyeagoro GA, Ogbobe O. effect of filler Characterization on the properties of chemically treated groundnut shell. Macromolecules. 2015;11:043-50. Available from: https://www.tsijournals.com/Abstract/effect-of-filler-Characterization-on-the-properties-of-chemically-treated-groundnut-shell-3519.html
- Boukhelkhal A, Benkortbi O, Hamadache M, Ghalem N, Hanini S, Amrane A. Adsorptive removal of amoxicillin from wastewater using wheat grains: equilibrium, kinetics, thermodynamic studies, and mass transfer. Desal Water Treat. 2013;57:27035-27047. Available from: https://doi.org/10.1080/19443994.2016.1166991
- Ahile UJ, Adejo SO, Tughgba MS, Tyohemba RL, Ama SO. Kinetic and equilibrium studies for the adsorption of amoxicillin from aqueous solution on carbonized groundnut shells. In: 2nd International Conference on Chemical, Biological and Environmental Sciences (ICCBES’15); May 20-21, 2015; Dubai, UAE. 2015. Available from: http://dx.doi.org/10.17758/IAAST.A0515011
- Jung C, Park J, Lim KH, Park S, Heo J, Her N, et al. Adsorption of seleCted endocrine disrupting compounds and pharmaceuticals on activated biochars. J Hazard Mater. 2013;263:702-710. Available from: https://doi.org/10.1016/j.jhazmat.2013.10.033
- Dhiman N, Sharma N. Removal of ciprofloxacin hydrochloride from aqueous solution using vertical bed and sequential bed columns. J Environ Chem Eng. 2018;6:4391-4398. Available from: https://doi.org/10.1016/j.jece.2018.06.064
- Alzaydien AS. Adsorption behavior of methyl orange onto wheat bran: role of surface and pH. Orient J Chem. 2015;31:643-651. Available from: http://dx.doi.org/10.13005/ojc/310205
- Dhiman N, Sharma N. Batch adsorption studies on the removal of ciprofloxacin hydrochloride from aqueous solution using ZnO nanoparticles and groundnut (Arachis hypogaea) shell powder: a comparison. Indian Chem Eng. 2019;1-11. Available from: https://doi.org/10.1080/00194506.2018.1424044
- Asiagwu AK, Owamah HI, Illoh VO. Kinetic and thermodynamic models for the removal of aminophenol (dye) from aqueous solutions using groundnut (Arachis hypogea) shells as the biomass. Adv Appl Sci Res. 2012;3:2257-2265. Available from: https://www.cabidigitallibrary.org/doi/full/10.5555/20123359921
- Naveed S, Qamar F. UV speCtrophotometric assay of diclofenac sodium available brands. J Innov Pharm Biol Sci. 2014;1:92-96. Available from: https://fisicoquimicausac2017.wordpress.com/wp-content/uploads/2017/09/praCtica-no-7-diclofenaco.pdf
- Sharma N, Dhiman N. Kinetic and thermodynamic studies for ciprofloxacin hydrochloride adsorption from aqueous solution on CuO nanoparticles. Int J ChemTech Res. 2017;10:98-106. Available from: https://sphinxsai.com/2017/ch_vol10_no5/1/(98-106)V10N5Ct.pdf
- Renu, Agarwal M, Singh K, Upadhyaya S, Dohare RK. Removal of heavy metals from wastewater using modified agricultural adsorbents. Mater Today Proc. 2017;4:10534-10538. Available from: http://dx.doi.org/10.1016/j.matpr.2017.06.415
- Khokhar TS, Memon AA, Panhwar QK. Emancipation of levofloxacin from its wheat bran composite. J Chem Soc Pak. 2016;38:1129-1138. Available from: https://inis.iaea.org/search/search.aspx?orig_q=RN:48038398
- Mahajan RK, Kaur S, Rani S. Adsorption kinetics for the removal of hazardous dye Congo red by biowaste materials as adsorbents. J Chem. 2013;1-12. Available from: https://doi.org/10.1155/2013/628582
- El-Deen EE, Zien Ghorab MM, Gad S, Yassin HA. Formulation and in-vitro evaluation of diclofenac sodium controlled release drug delivery system. Int J Adv Pharm Biol Chem. 2015;4(2):330-335. Available from: https://www.researchgate.net/publication/345394013_Formulation_and_In-vitro_Evaluation_of_Diclofenac_Sodium_Controlled_Release_Drug_Delivery_System
- Bajpai M, Rai N, Bajpai S K. Equilibrium adsorption studies on removal of diclofenac sodium from aqueous solution using sawdust-polyaniline (sd-pan) composites. J Appl Polym Sci. 2012;125:1382-1390. Available from: http://dx.doi.org/10.1002/app.35289
- Kanakaraju D, Motti CA, Glass BD, Oelgemoller M. Photolysis and TiO2-catalysed degradation of diclofenac in surface and drinking water using circulating batch photoreaCtors. Environ Chem. 2014;11:51-62. Available from: http://dx.doi.org/10.1071/EN13098
- Suriyanon N, Punyapalakul P, Ngamcharussrivichai C. Mechanistic study of diclofenac and carbamazepine adsorption on functionalized silica-based porous materials. Chem Eng J. 2013;214:208-218. Available from: http://dx.doi.org/10.1016/j.cej.2012.10.052
- Darweesh TM, Ahmed MJ. Adsorption of ciprofloxacin and norfloxacin from aqueous solution onto granular activated carbon in fixed bed column. Ecotoxicol Environ Saf. 2017;138:139-145. Available from: https://doi.org/10.1016/j.ecoenv.2016.12.032
- Gupta A, Garg A. Adsorption and oxidation of ciprofloxacin in a fixed bed column using activated sludge derived activated carbon. J Environ Manag. 2019;250:109474. Available from: https://doi.org/10.1016/j.jenvman.2019.109474
- Ajala OA, Akinnawo SO, Bamisaye A, Adedipe DN, Adesina MO, Okon-Akan OA, et al. Adsorptive removal of antibiotic pollutants from wastewater using biomass/biochar-based adsorbents. RSC Adv. 2023;13:4678-4712. Available from: https://doi.org/10.1039/d2ra06436g
- Kulkarni SJ, Kaware JP. Analysis of packed bed adsorption column with low-cost adsorbent for cadmium removal. Int J Therm Environ Eng. 2015;9:17-24. Available from: https://iasks.org/articles/ijtee-v09-i1-pp-17-24.pdf
- Ghosh A, Chakrabarti S, Ghosh UC. Fixed-bed column performance of Mn-incorporated iron(III) oxide nanoparticle agglomerates on As(III) removal from the spiked groundwater in lab bench scale. Chem Eng J. 2014;248:18-26. Available from: https://doi.org/10.1016/j.cej.2014.03.010
- Sotelo J L, Ovejero G, Rodriguez A, Alvarez S, Garcia J. Adsorption of carbamazepine in fixed bed columns: experimental and modeling studies. Sep Sci Technol. 2013;48:2626-2637. Available from: https://doi.org/10.1080/01496395.2013.808215