Figure 2
Photocatalytic Degradation of Microcystins-LR over Mesoporous graphitic Carbon Nitride (mpg-CN)
Laiyan Wu*, Jirong Lan, Anping Yang, Yanxi Zhao, Songbo Wang and Junjiang Zhu*
Published: 24 May, 2017 | Volume 1 - Issue 1 | Pages: 012-22
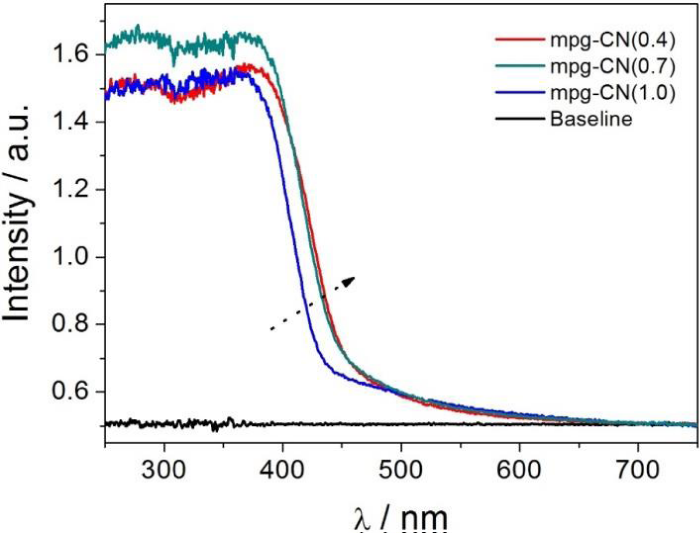
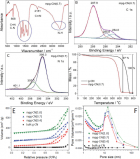
Figure 2:
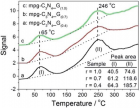
S1: (A) FI-IR, (B) C 1s XPS spectrum, (C) N 1s XPS spectrum, (D) TGA curves of the specific mpg-CN(0.7) sample; (E) N2 physisorption isotherms and (F) pore size distributions of the bulk g-CN and mpg-CN(r) samples. Note: for simplicity we show here only the characterization result of sample at r=0.7 in the A-D picture.
Read Full Article HTML DOI: 10.29328/journal.aac.1001002 Cite this Article Read Full Article PDF
More Images
Similar Articles
-
Photocatalytic Degradation of Microcystins-LR over Mesoporous graphitic Carbon Nitride (mpg-CN)Laiyan Wu*,Jirong Lan,Anping Yang,Yanxi Zhao,Songbo Wang,Junjiang Zhu*. Photocatalytic Degradation of Microcystins-LR over Mesoporous graphitic Carbon Nitride (mpg-CN). . 2017 doi: 10.29328/journal.aac.1001002; 1: 012-22
-
Convenient route synthesis of some new benzothiazole derivatives and their pharmacological screening as antimicrobial agentsAhmed A Fadda*,Nanees N Soliman,Ahmed Fekri. Convenient route synthesis of some new benzothiazole derivatives and their pharmacological screening as antimicrobial agents. . 2017 doi: 10.29328/journal.aac.1001004; 1: 032-046
-
Impact of alloimmunization on transfusion-dependent patientsSurapon Tangvarasittichai*. Impact of alloimmunization on transfusion-dependent patients. . 2017 doi: 10.29328/journal.aac.1001009; 1: 070-082
-
Treatment of antibiotic-resistant bacteria by nanoparticles: Current approaches and prospectsTigabu Bekele*,Getachew Alamnie. Treatment of antibiotic-resistant bacteria by nanoparticles: Current approaches and prospects. . 2022 doi: 10.29328/journal.aac.1001025; 6: 001-009
-
Surface energy of micro- and nanowireSerghei A Baranov*. Surface energy of micro- and nanowire. . 2023 doi: 10.29328/journal.aac.1001039; 7: 025-030
-
Methodology for Studying Combustion of Solid Rocket Propellants using Artificial Neural NetworksVictor Abrukov*, Weiqiang Pang, Darya Anufrieva. Methodology for Studying Combustion of Solid Rocket Propellants using Artificial Neural Networks. . 2024 doi: 10.29328/journal.aac.1001048; 8: 001-007
-
Comparative Studies of Diclofenac Sodium (NSAID) Adsorption on Wheat (Triticum aestivum) Bran and Groundnut (Arachis hypogaea) Shell Powder using Vertical and Sequential Bed ColumnNeha Dhiman*. Comparative Studies of Diclofenac Sodium (NSAID) Adsorption on Wheat (Triticum aestivum) Bran and Groundnut (Arachis hypogaea) Shell Powder using Vertical and Sequential Bed Column. . 2024 doi: 10.29328/journal.aac.1001052; 8: 021-029
Recently Viewed
-
An Interesting Autopsy Case Report of Acute Respiratory FailureJasleen Bhatia* and AK Das. An Interesting Autopsy Case Report of Acute Respiratory Failure. Arch Pathol Clin Res. 2023: doi: 10.29328/journal.apcr.1001036; 7: 017-019
-
In vitro, Anti-oxidant, and Anti-inflammatory Activity of Kalanchoe pinnataWijeratne Mudiyanselage Swarna Menu*. In vitro, Anti-oxidant, and Anti-inflammatory Activity of Kalanchoe pinnata. Arch Pharm Pharma Sci. 2025: doi: 10.29328/journal.apps.1001064; 9: 001-008
-
Green Synthesis of Citrus sinensis Peel (Orange Peel) Extract Silver Nanoparticle and its Various Pharmacological ActivitiesJ Bagyalakshmi,M Prathiksha. Green Synthesis of Citrus sinensis Peel (Orange Peel) Extract Silver Nanoparticle and its Various Pharmacological Activities. Arch Pharm Pharma Sci. 2025: doi: 10.29328/journal.apps.1001065; 9: 009-013
-
Unveiling the Impostor: Pulmonary Embolism Presenting as Pneumonia: A Case Report and Literature ReviewSaahil Kumar,Karuna Sree Alwa*,Mahesh Babu Vemuri,Anumola Gandhi Ganesh Gupta,Nuthan Vallapudasu,Sunitha Geddada. Unveiling the Impostor: Pulmonary Embolism Presenting as Pneumonia: A Case Report and Literature Review. J Pulmonol Respir Res. 2025: doi: 10.29328/journal.jprr.1001065; 9: 001-005
-
Dengue Epidemic during COVID-19 Pandemic: Clinical and Molecular Characterization – A Study from Western RajasthanPraveen Kumar Rathore,Eshank Gupta,Prabhu Prakash. Dengue Epidemic during COVID-19 Pandemic: Clinical and Molecular Characterization – A Study from Western Rajasthan. Int J Clin Virol. 2025: doi: 10.29328/journal.ijcv.1001063; 9: 005-009
Most Viewed
-
Evaluation of Biostimulants Based on Recovered Protein Hydrolysates from Animal By-products as Plant Growth EnhancersH Pérez-Aguilar*, M Lacruz-Asaro, F Arán-Ais. Evaluation of Biostimulants Based on Recovered Protein Hydrolysates from Animal By-products as Plant Growth Enhancers. J Plant Sci Phytopathol. 2023 doi: 10.29328/journal.jpsp.1001104; 7: 042-047
-
Sinonasal Myxoma Extending into the Orbit in a 4-Year Old: A Case PresentationJulian A Purrinos*, Ramzi Younis. Sinonasal Myxoma Extending into the Orbit in a 4-Year Old: A Case Presentation. Arch Case Rep. 2024 doi: 10.29328/journal.acr.1001099; 8: 075-077
-
Feasibility study of magnetic sensing for detecting single-neuron action potentialsDenis Tonini,Kai Wu,Renata Saha,Jian-Ping Wang*. Feasibility study of magnetic sensing for detecting single-neuron action potentials. Ann Biomed Sci Eng. 2022 doi: 10.29328/journal.abse.1001018; 6: 019-029
-
Pediatric Dysgerminoma: Unveiling a Rare Ovarian TumorFaten Limaiem*, Khalil Saffar, Ahmed Halouani. Pediatric Dysgerminoma: Unveiling a Rare Ovarian Tumor. Arch Case Rep. 2024 doi: 10.29328/journal.acr.1001087; 8: 010-013
-
Physical activity can change the physiological and psychological circumstances during COVID-19 pandemic: A narrative reviewKhashayar Maroufi*. Physical activity can change the physiological and psychological circumstances during COVID-19 pandemic: A narrative review. J Sports Med Ther. 2021 doi: 10.29328/journal.jsmt.1001051; 6: 001-007

HSPI: We're glad you're here. Please click "create a new Query" if you are a new visitor to our website and need further information from us.
If you are already a member of our network and need to keep track of any developments regarding a question you have already submitted, click "take me to my Query."


